
Phần 3: Cài Đặt Grafana – Prometheus giám sát hệ thống trên portainer
Bài viết hướng dẫn triển khai hệ thống Monitoring gồm 4 thành phần: Prometheus – Thu thập dữ liệu Grafana – Dashboard ...
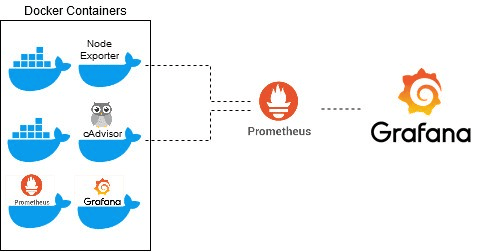

Bài viết hướng dẫn triển khai hệ thống Monitoring gồm 4 thành phần:
- Prometheus – Thu thập dữ liệu
- Grafana – Dashboard
- node-exporter – Monitor OS
- cAdvisor – Monitor Docker containers
I. Tạo Network cho Stack (SSH Server host)
Stack dưới đây yêu cầu network tên docker-net. Nếu chưa có, hãy tạo:
docker network create docker-netII. Chuẩn Bị Cấu Hình Prometheus (SSH Server host)
1. Tạo thư mục chứa config
mkdir -p /root/prometheus2. Tạo file cấu hình prometheus.yml
nano /root/prometheus/prometheus.ymlDán nội dung sau:
global:
scrape_interval: 15s
scrape_configs:
-
job_name: ‘prometheus’
static_configs:
- targets: [‘localhost:9090’]
-
job_name: ‘node-exporter’
static_configs:
- targets: [‘node-exporter:9100’]
-
job_name: ‘cadvisor’
static_configs:
- targets: [‘cadvisor:8080’]
Prometheus sẽ đọc file này từ host:
/root/prometheus/prometheus.yml.III. Triển khai trên Portainer bằng Stack
1. Mở Portainer
Truy cập:
http://IP:90002. Mở mục Stacks
- Chọn Stacks
- Bấm Add Stack
3. Đặt tên stack
Ví dụ:
monitoring-stack4. Dán toàn bộ docker-compose vào Web Editor
version: "3"
services:
prometheus:
image: prom/prometheus:latest
container_name: prometheus
volumes:
- /root/prometheus:/etc/prometheus
- prometheus-data:/prometheus
networks:
- docker-net
mem_limit: 1500m
cpus: 0.3
ports:
- “9090:9090”
command:
- “–config.file=/etc/prometheus/prometheus.yml”
grafana:
image: grafana/grafana:latest
container_name: grafana
ports:
- “3000:3000”
volumes:
- grafana-data:/var/lib/grafana
networks:
- docker-net
mem_limit: 1500m
cpus: 0.3
environment:
- GF_SERVER_ROOT_URL=http://grafana-01.lab
- GF_SECURITY_ADMIN_USER=admin
- GF_SECURITY_ADMIN_PASSWORD=admin
node-exporter:
image: quay.io/prometheus/node-exporter:latest
container_name: node-exporter
pid: host
command:
- ‘–path.rootfs=/host’
volumes:
- ‘/:/host:ro,rslave’
networks:
- docker-net
mem_limit: 1500m
cpus: 0.3
cadvisor:
image: gcr.io/cadvisor/cadvisor:latest
container_name: cadvisor
ports:
- “8080:8080”
volumes:
- /:/rootfs:ro
- /var/run:/var/run:ro
- /sys:/sys:ro
- /var/lib/docker/:/var/lib/docker:ro
networks:
- docker-net
mem_limit: 1500m
cpus: 0.3
volumes:
prometheus-data:
grafana-data:
networks:
docker-net:
external: true


Lưu ý: Port ánh xạ từ docker host > container, cần quy hoạch để không trùng, nếu các port 9090, 3000, 8080,… đã được dùng cho app khác thì cần đổi port mới.
5. Nhấn “Deploy the Stack”
Sau khi deploy, Portainer sẽ tạo 4 container:
- prometheus
- grafana
- node-exporter
- cadvisor

IV. Kiểm Tra Hoạt Động
- Prometheus:
http://server:9090/targets - Grafana:
http://server:3000 - cAdvisor:
http://server:8080
V. Giải thích từng thành phần trong Stack
1. Prometheus
- Lưu dữ liệu trong
prometheus-data - Đọc config từ
/root/prometheus - Cổng: 9090
2. Grafana
- Lưu dashboard:
grafana-data - Cổng: 3000
- Login: admin / admin
3. node-exporter
- Đọc CPU/RAM/Disk của host
- Dùng
pid: host
4. cAdvisor
- Monitor Docker containers
- Cổng: 8080
VI. Kết luận
Hệ thống Monitoring đầy đủ đã được triển khai bằng Portainer, theo đúng thứ tự chuẩn: tạo network → tạo config → deploy stack.

— Hết —
Bài trước: Docker Homelab Series – Phần 2: Hướng Dẫn Tạo Template Custom Trên Portainer